A better eye on reefs

A better eye on reefs

Earth Observatory images by Jesse Allen and Robert Simmon, using data provided by the U.S. Geological Survey. Caption by Michael Carlowicz.

June 17, 2013

From NASA's Earth Observatory

The concept behind Landsat is to gather images of Earth’s land surfaces. But in four decades of service to science, the satellites have proven to themselves quite useful for observing some blue parts of the planet, too.

The study of coral reefs has been particularly enriched by Landsat. Scientists used earlier generations of Landsats to create a global image library of coral reefs. They have also been able to do time-series assessments of the health of some reefs. For instance, researchers used 18 years of Landsat data to show a decline in the health of reef habitat across roughly 68 percent of the Florida Keys National Marine Sanctuary. Satellite images also can detect signs of trawling and other fishing activities that can be harmful to reefs.

“The remote location and massive size of reefs make them an ideal subject for Landsat remote sensing,” said Phillip Dustan, a marine biologist at the College of Charleston (South Carolina) who has worked with Landsat to map reefs around the world. “Reef management benefits from satellite imagery through mapping, change analysis, and threat assessment, While a single image can be used to provide mapping data, the long-term data set provided by Landsat makes for powerful time series of images that can probe the dynamics of ecological change.”

This image of Princess Charlotte Bay in Australia was acquired by the Operational Land Imager (OLI) on Landsat 8 on April 20, 2013, while the satellite was still being calibrated and checked out. The area lies along the east coast of Queensland’s Cape York Peninsula. The scene shows Claremont Isles National Park, where coastal waters are protected as part of Great Barrier Reef World Heritage Site. The islands are important habitat and breeding grounds for seabirds, and they are off-limits to humans.

“Coral reefs continue to change rapidly in response to stresses applied at scales from local to global,” Dustan added. “The very adaptations that make corals so successful in nutrient-poor, clear tropical waters also leave them vulnerable to climate- and ocean chemistry change.”

Landsat 8 has better spatial resolution and greater sensitivity to brightness and color, known as dynamic range.The OLI image above uses a combination of red, green, and shortwave blue light—a special band of wavelengths(0.43–0.45 micrometers) that scientists call “coastal blue”—to better distinguish features in coastal waters.

Near the coast, weather patterns, natural aerosols, air pollutants, waves and currents, and floating material can distort, reflect, and refract light signals. The coastal blue band can be compared with other wavelengths to remove this environmental “noise” and better tease out fine structures. The blue band is also similar to wavelengths observed by previous NASA satellite sensors, so Landsat 8 allows researchers to extend scientific records that go back decades.

Further Reading

  1. Great Barrier Reef Marine Park Authority (2011) Outlook for the Reef. Accessed June 14, 2013.
  2. NASA (2004, November 4) New Worldwide Coral Reef Library Created. Accessed June 14, 2013.
  3. NASA Earth Observatory (2013, May 31) Bay Blues.
  4. NASA Earth Observatory (2007, March 29) River Plumes Threaten Great Barrier Reef.
  5. NASA Earth Observatory (2001, March 12) Mapping the Decline of Coral Reefs.
  6. NASA Landsat Science (2008, August 31) Landsat Important to Coastal Studies. Accessed June 14, 2013.
  7. NASA Landsat Science (2006, April 6) Mapping Coral Reefs. Accessed June 14, 2013.
  8. Queensland Government (2013) Claremont Isles National Park. Accessed June 14, 2013.
  9. U.S. Geological Survey Landsat. Accessed June 14, 2013.

Warming ocean causing most Antarctic ice shelf mass loss

Warming ocean causing most Antarctic ice shelf mass loss

Warming ocean causing most Antarctic ice shelf mass loss

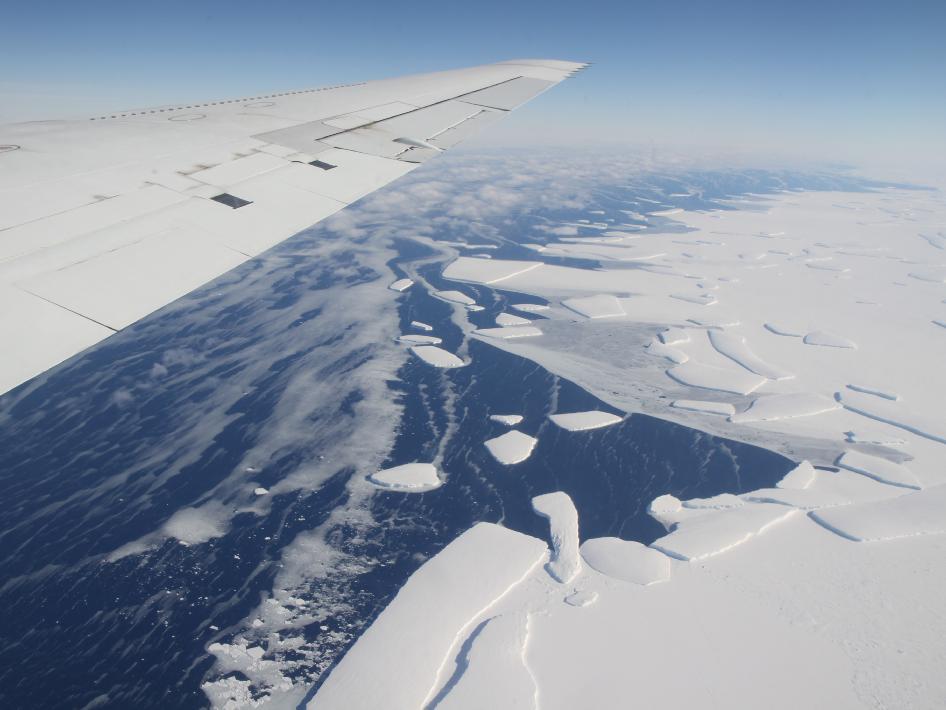
This photo shows the ice front of Venable Ice Shelf, West Antarctica, in October 2008. Image credit: NASA/JPL-Caltech/UC Irvine

June 13, 2013

By Whitney Clavin,
NASA Jet Propulsion Laboratory

By J.D. Harrington,
NASA Headquarters

By Maria-Jose Vinas Garcia,
NASA Goddard Space Flight Center

PASADENA, Calif. -- Ocean waters melting the undersides of Antarctic ice shelves are responsible for most of the continent's ice shelf mass loss, a new study by NASA and university researchers has found.

Scientists have studied the rates of basal melt, or the melting of the ice shelves from underneath, of individual ice shelves, the floating extensions of glaciers that empty into the sea. But this is the first comprehensive survey of all Antarctic ice shelves. The study found basal melt accounted for 55 percent of all Antarctic ice shelf mass loss from 2003 to 2008, an amount much higher than previously thought.

Rates of basal melt of Antarctic ice shelves (melting of the shelves from underneath) overlaid on a 2009 mosaic of Antarctica created from data from NASA's Moderate Resolution Imaging Spectroradiometer (MODIS) instrument aboard NASA's Terra and Aqua spacecraft. Red shades denote melt rates of less than 5 meters (16.4 feet) per year (freezing conditions), while blue shades represent melt rates of greater than 5 meters (16.4 feet) per year (melting conditions). The perimeters of the ice shelves in 2007-2008, excluding ice rises and ice islands, are shown by thin black lines. Each circular graph is proportional in area to the total ice mass loss measured from each ice shelf, in gigatons per year, with the proportion of ice lost due to the calving of icebergs denoted by hatched lines and the proportion due to basal melting denoted in black. Image credit: NASA/JPL-Caltech/UC Irvine/Columbia University


The study uses reconstructions of ice accumulation, satellite and aircraft readings of ice thickness, and changes in elevation and ice velocity to determine how fast ice shelves melt and compare the mass lost with the amount released by the calving, or splitting, of icebergs.

"The traditional view on Antarctic mass loss is it is almost entirely controlled by iceberg calving," said Eric Rignot of NASA's Jet Propulsion Laboratory in Pasadena, Calif., and the University of California, Irvine. Rignot is lead author of the study to be published in the June 14 issue of the journal Science. "Our study shows melting from below by the ocean waters is larger, and this should change our perspective on the evolution of the ice sheet in a warming climate."

Ice shelves grow through a combination of land ice flowing to the sea and snow accumulating on their surface. To determine how much ice and snowfall enters a specific ice shelf and how much makes it to an iceberg, where it may split off, the research team used a regional climate model for snow accumulation and combined the results with ice velocity data from satellites, ice shelf thickness measurements from NASA's Operation IceBridge -- a continuing aerial survey of Earth's poles -- and a new map of Antarctica's bedrock. Using this information, Rignot and colleagues were able to deduce whether the ice shelf was losing mass through basal melting or gaining it through the basal freezing of seawater.

In some places, basal melt exceeds iceberg calving. In other places, the opposite is true. But in total, Antarctic ice shelves lost 2,921 trillion pounds (1,325 trillion kilograms) of ice per year in 2003 to 2008 through basal melt, while iceberg formation accounted for 2,400 trillion pounds (1,089 trillion kilograms) of mass loss each year.


Basal melt can have a greater impact on ocean circulation than glacier calving. Icebergs slowly release melt water as they drift away from the continent. But strong melting near deep grounding lines, where glaciers lose their grip on the seafloor and start floating as ice shelves, discharges large quantities of fresher, lighter water near the Antarctic coastline. This lower-density water does not mix and sink as readily as colder, saltier water, and may be changing the rate of bottom water renewal.

"Changes in basal melting are helping to change the properties of Antarctic bottom water, which is one component of the ocean's overturning circulation," said author Stan Jacobs, an oceanographer at Columbia University's Lamont-Doherty Earth Observatory in Palisades, N.Y. "In some areas it also impacts ecosystems by driving coastal upwelling, which brings up micronutrients like iron that fuel persistent plankton blooms in the summer."

Calving front of the calving front of an ice shelf in West Antarctica. The traditional view on ice shelves, the floating extensions of seaward glaciers, has been that they mostly lose ice by shedding icebergs. A new study by NASA and university researchers has found that warm ocean waters melting the ice sheets from underneath account for 55 percent of all ice shelf mass loss in Antarctica. This image was taken during the 2012 Antarctic campaign of NASA's Operation IceBridge, a mission that provided data for the new ice shelf study. Image credit: NASA/GSFC/Jefferson Beck

The study found basal melting is distributed unevenly around the continent. The three giant ice shelves of Ross, Filchner and Ronne, which make up two-thirds of the total Antarctic ice shelf area, accounted for only 15 percent of basal melting. Meanwhile, fewer than a dozen small ice shelves floating on "warm" waters (seawater only a few degrees above the freezing point) produced half of the total melt water during the same period. The scientists detected a similar high rate of basal melting under six small ice shelves along East Antarctica, a region not as well known because of a scarcity of measurements.

The researchers also compared the rates at which the ice shelves are shedding ice to the speed at which the continent itself is losing mass and found that, on average, ice shelves lost mass twice as fast as the Antarctic ice sheet did during the study period.

"Ice shelf melt doesn't necessarily mean an ice shelf is decaying; it can be compensated by the ice flow from the continent," Rignot said. "But in a number of places around Antarctica, ice shelves are melting too fast, and a consequence of that is glaciers and the entire continent are changing as well."

Imagery related to this release is online at: http://go.nasa.gov/14WBYp1.