A better eye on reefs

A better eye on reefs

Earth Observatory images by Jesse Allen and Robert Simmon, using data provided by the U.S. Geological Survey. Caption by Michael Carlowicz.

June 17, 2013

From NASA's Earth Observatory

The concept behind Landsat is to gather images of Earth’s land surfaces. But in four decades of service to science, the satellites have proven to themselves quite useful for observing some blue parts of the planet, too.

The study of coral reefs has been particularly enriched by Landsat. Scientists used earlier generations of Landsats to create a global image library of coral reefs. They have also been able to do time-series assessments of the health of some reefs. For instance, researchers used 18 years of Landsat data to show a decline in the health of reef habitat across roughly 68 percent of the Florida Keys National Marine Sanctuary. Satellite images also can detect signs of trawling and other fishing activities that can be harmful to reefs.

“The remote location and massive size of reefs make them an ideal subject for Landsat remote sensing,” said Phillip Dustan, a marine biologist at the College of Charleston (South Carolina) who has worked with Landsat to map reefs around the world. “Reef management benefits from satellite imagery through mapping, change analysis, and threat assessment, While a single image can be used to provide mapping data, the long-term data set provided by Landsat makes for powerful time series of images that can probe the dynamics of ecological change.”

This image of Princess Charlotte Bay in Australia was acquired by the Operational Land Imager (OLI) on Landsat 8 on April 20, 2013, while the satellite was still being calibrated and checked out. The area lies along the east coast of Queensland’s Cape York Peninsula. The scene shows Claremont Isles National Park, where coastal waters are protected as part of Great Barrier Reef World Heritage Site. The islands are important habitat and breeding grounds for seabirds, and they are off-limits to humans.

“Coral reefs continue to change rapidly in response to stresses applied at scales from local to global,” Dustan added. “The very adaptations that make corals so successful in nutrient-poor, clear tropical waters also leave them vulnerable to climate- and ocean chemistry change.”

Landsat 8 has better spatial resolution and greater sensitivity to brightness and color, known as dynamic range.The OLI image above uses a combination of red, green, and shortwave blue light—a special band of wavelengths(0.43–0.45 micrometers) that scientists call “coastal blue”—to better distinguish features in coastal waters.

Near the coast, weather patterns, natural aerosols, air pollutants, waves and currents, and floating material can distort, reflect, and refract light signals. The coastal blue band can be compared with other wavelengths to remove this environmental “noise” and better tease out fine structures. The blue band is also similar to wavelengths observed by previous NASA satellite sensors, so Landsat 8 allows researchers to extend scientific records that go back decades.

Further Reading

  1. Great Barrier Reef Marine Park Authority (2011) Outlook for the Reef. Accessed June 14, 2013.
  2. NASA (2004, November 4) New Worldwide Coral Reef Library Created. Accessed June 14, 2013.
  3. NASA Earth Observatory (2013, May 31) Bay Blues.
  4. NASA Earth Observatory (2007, March 29) River Plumes Threaten Great Barrier Reef.
  5. NASA Earth Observatory (2001, March 12) Mapping the Decline of Coral Reefs.
  6. NASA Landsat Science (2008, August 31) Landsat Important to Coastal Studies. Accessed June 14, 2013.
  7. NASA Landsat Science (2006, April 6) Mapping Coral Reefs. Accessed June 14, 2013.
  8. Queensland Government (2013) Claremont Isles National Park. Accessed June 14, 2013.
  9. U.S. Geological Survey Landsat. Accessed June 14, 2013.

Warming ocean causing most Antarctic ice shelf mass loss

Warming ocean causing most Antarctic ice shelf mass loss

Warming ocean causing most Antarctic ice shelf mass loss

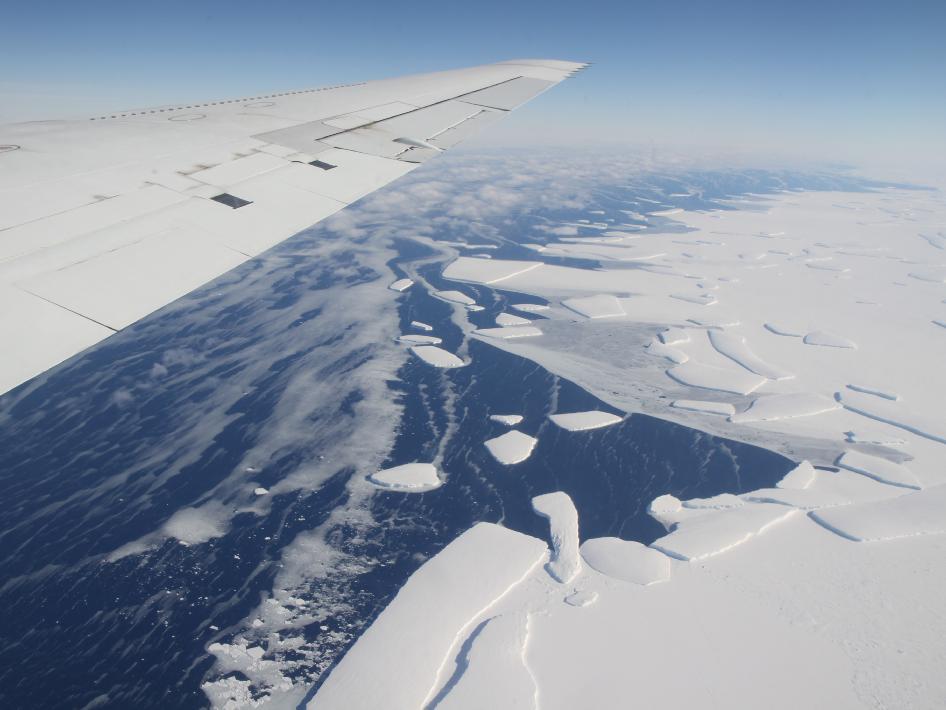
This photo shows the ice front of Venable Ice Shelf, West Antarctica, in October 2008. Image credit: NASA/JPL-Caltech/UC Irvine

June 13, 2013

By Whitney Clavin,
NASA Jet Propulsion Laboratory

By J.D. Harrington,
NASA Headquarters

By Maria-Jose Vinas Garcia,
NASA Goddard Space Flight Center

PASADENA, Calif. -- Ocean waters melting the undersides of Antarctic ice shelves are responsible for most of the continent's ice shelf mass loss, a new study by NASA and university researchers has found.

Scientists have studied the rates of basal melt, or the melting of the ice shelves from underneath, of individual ice shelves, the floating extensions of glaciers that empty into the sea. But this is the first comprehensive survey of all Antarctic ice shelves. The study found basal melt accounted for 55 percent of all Antarctic ice shelf mass loss from 2003 to 2008, an amount much higher than previously thought.

Rates of basal melt of Antarctic ice shelves (melting of the shelves from underneath) overlaid on a 2009 mosaic of Antarctica created from data from NASA's Moderate Resolution Imaging Spectroradiometer (MODIS) instrument aboard NASA's Terra and Aqua spacecraft. Red shades denote melt rates of less than 5 meters (16.4 feet) per year (freezing conditions), while blue shades represent melt rates of greater than 5 meters (16.4 feet) per year (melting conditions). The perimeters of the ice shelves in 2007-2008, excluding ice rises and ice islands, are shown by thin black lines. Each circular graph is proportional in area to the total ice mass loss measured from each ice shelf, in gigatons per year, with the proportion of ice lost due to the calving of icebergs denoted by hatched lines and the proportion due to basal melting denoted in black. Image credit: NASA/JPL-Caltech/UC Irvine/Columbia University


The study uses reconstructions of ice accumulation, satellite and aircraft readings of ice thickness, and changes in elevation and ice velocity to determine how fast ice shelves melt and compare the mass lost with the amount released by the calving, or splitting, of icebergs.

"The traditional view on Antarctic mass loss is it is almost entirely controlled by iceberg calving," said Eric Rignot of NASA's Jet Propulsion Laboratory in Pasadena, Calif., and the University of California, Irvine. Rignot is lead author of the study to be published in the June 14 issue of the journal Science. "Our study shows melting from below by the ocean waters is larger, and this should change our perspective on the evolution of the ice sheet in a warming climate."

Ice shelves grow through a combination of land ice flowing to the sea and snow accumulating on their surface. To determine how much ice and snowfall enters a specific ice shelf and how much makes it to an iceberg, where it may split off, the research team used a regional climate model for snow accumulation and combined the results with ice velocity data from satellites, ice shelf thickness measurements from NASA's Operation IceBridge -- a continuing aerial survey of Earth's poles -- and a new map of Antarctica's bedrock. Using this information, Rignot and colleagues were able to deduce whether the ice shelf was losing mass through basal melting or gaining it through the basal freezing of seawater.

In some places, basal melt exceeds iceberg calving. In other places, the opposite is true. But in total, Antarctic ice shelves lost 2,921 trillion pounds (1,325 trillion kilograms) of ice per year in 2003 to 2008 through basal melt, while iceberg formation accounted for 2,400 trillion pounds (1,089 trillion kilograms) of mass loss each year.


Basal melt can have a greater impact on ocean circulation than glacier calving. Icebergs slowly release melt water as they drift away from the continent. But strong melting near deep grounding lines, where glaciers lose their grip on the seafloor and start floating as ice shelves, discharges large quantities of fresher, lighter water near the Antarctic coastline. This lower-density water does not mix and sink as readily as colder, saltier water, and may be changing the rate of bottom water renewal.

"Changes in basal melting are helping to change the properties of Antarctic bottom water, which is one component of the ocean's overturning circulation," said author Stan Jacobs, an oceanographer at Columbia University's Lamont-Doherty Earth Observatory in Palisades, N.Y. "In some areas it also impacts ecosystems by driving coastal upwelling, which brings up micronutrients like iron that fuel persistent plankton blooms in the summer."

Calving front of the calving front of an ice shelf in West Antarctica. The traditional view on ice shelves, the floating extensions of seaward glaciers, has been that they mostly lose ice by shedding icebergs. A new study by NASA and university researchers has found that warm ocean waters melting the ice sheets from underneath account for 55 percent of all ice shelf mass loss in Antarctica. This image was taken during the 2012 Antarctic campaign of NASA's Operation IceBridge, a mission that provided data for the new ice shelf study. Image credit: NASA/GSFC/Jefferson Beck

The study found basal melting is distributed unevenly around the continent. The three giant ice shelves of Ross, Filchner and Ronne, which make up two-thirds of the total Antarctic ice shelf area, accounted for only 15 percent of basal melting. Meanwhile, fewer than a dozen small ice shelves floating on "warm" waters (seawater only a few degrees above the freezing point) produced half of the total melt water during the same period. The scientists detected a similar high rate of basal melting under six small ice shelves along East Antarctica, a region not as well known because of a scarcity of measurements.

The researchers also compared the rates at which the ice shelves are shedding ice to the speed at which the continent itself is losing mass and found that, on average, ice shelves lost mass twice as fast as the Antarctic ice sheet did during the study period.

"Ice shelf melt doesn't necessarily mean an ice shelf is decaying; it can be compensated by the ice flow from the continent," Rignot said. "But in a number of places around Antarctica, ice shelves are melting too fast, and a consequence of that is glaciers and the entire continent are changing as well."

Imagery related to this release is online at: http://go.nasa.gov/14WBYp1.


Climate Change Facts: Answers to Common Questions

Is there a scientific consensus on climate change?

The major scientific agencies of the United States — including the National Aeronautics and Space Administration (NASA) and the National Oceanic and Atmospheric Administration (NOAA) — agree that climate change is occurring and that humans are contributing to it. In 2010, the National Research Council concluded that "Climate change is occurring, is very likely caused by human activities, and poses significant risks for a broad range of human and natural systems". [1] Many independent scientific organizations have released similar statements, both in the United States and abroad. This doesn't necessarily mean that every scientist sees eye to eye on each component of the climate change problem, but broad agreement exists that climate change is happening and is primarily caused by excess greenhouse gases from human activities.


Scientists are still researching a number of important questions, including exactly how much Earth will warm, how quickly it will warm, and what the consequences of the warming will be in specific regions of the world. Scientists continue to research these questions so society can be better informed about how to plan for a changing climate. However, enough certainty exists about basic causes and effects of climate change to justify taking actions that reduce future risks.

» Learn more about climate change science.

Close

What is the evidence that proves the climate is changing?

The global average temperature increased by more than 1.4°F over the last century. [2] In fact, according to the National Oceanic and Atmospheric Administration (NOAA), the decade from 2000 to 2010 was the warmest on record, and 2010 was tied with 2005 as the warmest year on record. [3] Rising global temperatures have also been accompanied by other changes in weather and climate. Many places have experienced changes in rainfall resulting in more intense rain, as well as more frequent and severe heat waves. The planet's oceans and glaciers have also experienced changes: oceans are warming and becoming more acidic, ice caps are melting, and sea levels are rising. [4] All of these changes are evidence that our world is getting warmer.


» Learn more about the indicators of climate change.

Close

Are human activities or natural variations in climate responsible for the climate change being observed today?

The Earth does go through natural cycles of warming and cooling, caused by factors such as changes in the sun or volcanic activity. This has been closely examined, and the warming we have seen in the past 50 years cannot be explained by natural factors alone. [5] This figure illustrates one piece of evidence that shows that recent global warming is primarily a result of greenhouse gas emissions from human activities.


» Learn more about the causes of climate change.

Models that account only for the effects of natural processes are not able to explain the warming over the past century. Models that also account for the greenhouse gases emitted by humans are able to explain this warming. View enlarged image

This figure shows the observed average global temperatures from 1900 to 2000 (black line) along with the temperature ranges predicted by climate models. The blue band shows the expected temperature range based on climate models that account only for natural forces. The pink band represents the temperature range predicted by climate models that also include emissions of greenhouse gases from human activities. The recent increase in average global temperatures aligns with the predicted temperatures from the model that includes the greenhouse gas emission.
Source: USGRCP 2009

Close

Is climate change influenced more by human activities and excess greenhouse gases or changes in the sun's energy?

The sun has natural periods of warming and cooling. With satellites, scientists have measured fluctuations in the sun's energy and found that these recent variations have been small in comparison to human influences in the last several centuries, with no increase in solar energy in the past 50 years. [2] Thus, changes in the sun's energy cannot explain the warming we have seen over the past several decades. In contrast, the warming we are observing is consistent with the warming properties of carbon dioxide and other heat-trapping gases that we are adding to the atmosphere.


» Learn more about the causes of climate change.

» Learn more about greenhouse gases.

Close

How can carbon dioxide hurt us?

Carbon dioxide is a necessary ingredient for plants to perform photosynthesis, and a critical component of our atmosphere. However, you can have too much of a good thing. The excess carbon dioxide we are adding to the atmosphere increases global temperatures, leading to climate changes that can harm plants, animals, and humans.


» Learn more about the impacts of climate change on society and ecosystems


Close

How can a change of one or two degrees in global average temperatures have an impact on our lives?

Changing the average global temperature by even a degree or two can lead to serious consequences around the globe. For about every 2°F of warming, we can expect to see

  • 5—15% reductions in the yields of crops as currently grown
  • 3—10% increases in the amount of rain falling during the heaviest precipitation events, which can increase flooding risks
  • 5—10% decreases in stream flow in some river basins, including the Arkansas and the Rio Grande
  • 200%—400% increases in the area burned by wildfire in parts of the western United States [6]

Global average temperatures have increased more than 1.4 degrees Fahrenheit over the last 100 years. [2] Many of the extreme precipitation and heat events that we have seen in recent years are consistent with what we would expect given this amount of warming. [5] Scientists project that Earth's average temperatures will rise between 2 and 12 degrees Fahrenheit by 2100. [1]


» Learn more about the future of climate change.

Close

Do a few extra cold or snowy winters in your hometown mean that climate change is not happening?

A few extra cold or snowy winters in your hometown doesn't mean that global warming isn't happening. We know thatglobal average temperatures are rising. However, even with this global warming, at the local or regional level, we can expect to have some colder-than-average seasons or even colder-than-average years. For example, in the Eastern United States, the winters of 2010 and 2011 were colder than the average winters from the previous decades. In fact, extra snowy winters can be expected. In a warmer climate, more water vapor is held in the atmosphere causing more intense rain and snow storms. As the climate warms, we do expect the duration of the snow season to decrease — however, as long as it is still cold enough to snow, a warming climate can lead to bigger snowstorms. [5]


» Learn more about weather and climate.

Close

How does water vapor in our atmosphere contribute to global warming?

Higher concentrations of carbon dioxide and other greenhouse gases in the atmosphere cause Earth to warm. Warmer temperatures increase the amount of water vapor in the atmosphere. Because water vapor is a greenhouse gas this leads to even further warming. In this way, water vapor actually magnifies the warming caused by excess carbon dioxide and other greenhouse gases. [5]


» Learn more about the causes of climate change.

Close

Do emissions of carbon dioxide from human activities have a big impact on Earth's climate?

Plants, oceans, and soils release and absorb large quantities of carbon dioxide as a part of the Earth's natural carbon cycle. These natural emissions and absorptions of carbon dioxide on average balance out over time. However, the carbon dioxide from human activities is not part of this natural balance. Ice core measurements reveal that carbon dioxide levels in the atmosphere are higher than they have been for at least 800,000 years. [5] The global warming that has been observed in recent decades was caused by elevated levels of carbon dioxide and other greenhouse gases in the atmosphere, due primarily to human activities. [1]


» Learn more about the recent role of the greenhouse effect.

Close

In the past, has Earth been warmer than it is today? If so, does that mean we shouldn't worry about global warming?

There were times in the distant past when Earth was warmer than it is now. However, human societies have developed and thrived during the relatively stable climate that has existed since the last ice age. Due to excess carbon dioxide pollution, the climate is no longer stable and is instead projected to change faster than at any other time in human history. This rapid climate change will expose people to serious risks. Sea level rise, increasing droughts and wildfires in some regions and increasing flooding in others, more heat waves, and other effects of climate change all pose risks to human health, infrastructure critical to our homes, roads, and cities, and the ecosystems that support us. [5]


» Learn more about the impacts of climate change on society and ecosystems.

Close

Is the hole in the ozone layer related to the climate change we are seeing today?

The ozone hole and climate change are essentially two separate issues. The "ozone hole" refers to the destruction of a layer of ozone molecules found high in Earth's atmosphere. When healthy, this ozone layer helps to shield Earth from the sun's harmful ultraviolet rays. The ozone layer has become thinner because of chemicals called chlorofluorocarbons that were once commonly used in products ranging from spray cans to foam furniture cushions. A thinner ozone layer allows more ultraviolet rays to reach Earth, increasing the risk to humans from skin cancer, cataracts, and other health impacts. This, however, has only minor effects on climate change.


» Learn more about the science of stratospheric ozone depletion.

Close

Will a small rise in sea level affect people (even in the United States)?

A small rise in sea level will affect many people, even in the United States. The amount of sea level rise expected to occur as a result of climate change will increase the risk of coastal flooding for millions to hundreds of millions of people around the world, many of whom would have to permanently leave their homes. [7] Global sea level has risen approximately 9 inches, on average, in the last 140 years. [4] This has already put some coastal homes, beaches, roads, bridges, and wildlife at risk. [5] By the year 2100, sea level is expected to rise another 1.5 to 3 feet. [6] Rising seas will make coastal storms and the associated storm surges more frequent and destructive. For example, in New York City what is currently termed a once-in-a-century coastal flooding event could occur as frequently as once per decade. [5]


» Learn more about the impacts of climate change on coastal areas.

Close

Are the temperature records showing global warming is happening reliable?

Multiple temperature records from all over the world have all shown a warming trend, and these records have been deemed reliable by the National Aeronautics and Space Administration (NASA), and the National Oceanic and Atmospheric Administration (NOAA), among others. [8] Other observations that point to higher global temperature includes: warmer oceans, melting arctic sea ice and glaciers, sea level rise, increasing precipitation, and changing wind patterns. [4]


» Learn more about climate change indicators.

Close

Is it too late to do anything about climate change?

It is not too late to have a significant impact on future climate change and its effects on us. With appropriate actions by governments, communities, individuals, and businesses, we can reduce the amount of greenhouse gas pollution we release and lower the risk of much greater warming and severe consequences. Many of the actions that we can take to address climate change will have other benefits, such as cleaner, healthier air. In addition, communities can take action to prepare for the changes we know are coming.


» Learn more about adapting to climate change and what you can do to combat climate change.

Close

References

  1. NRC (2011). America's Climate Choices: Final Report . Exit EPA Disclaimer National Research Council. The National Academies Press, Washington, DC, USA.
  2. NRC (2010). Advancing the Science of Climate Change . Exit EPA Disclaimer National Research Council. The National Academies Press, Washington, DC, USA.
  3. NOAA (2011). 2010 Tied For Warmest Year on Record . National Oceanic and Atmospheric Administration. Accessed 3/16/2012.
  4. EPA (2010). Climate Change Indicators in the United States . U.S. Environmental Protection Agency, Washington, DC, USA.
  5. USGCRP (2009). Global Climate Change Impacts in the United States . Thomas R. Karl, Jerry M. Melillo, and Thomas C. Peterson (eds.). United States Global Change Research Program. Cambridge University Press, New York, NY, USA.
  6. NRC (2011). Climate Stabilization Targets: Emissions, Concentrations, and Impacts over Decades to Millennia . Exit EPA Disclaimer National Research Council. The National Academies Press, Washington, DC, USA.
  7. IPCC (2007). Climate Change 2007: Synthesis Report . Exit EPA Disclaimer Contribution of Working Groups I, II and III to the Fourth Assessment Report of the Intergovernmental Panel on Climate Change [Pachauri, R.K. and A. Reisinger (eds.)]. Geneva, Switzerland.

Expert Commentary about 2012 Global Temperatures

Expert Commentary about 2012 Global Temperatures

February 01, 2013; 6:09 PM

Dr. James Hansen, who is the director of NASA's Goddard Institute for Space Studies (GISS) recently wrote a summary about the global temperature anomalies for 2012 with assistance from Dr. Makiko Sato and R. Ruedy.

Last year was the 9th warmest year on record globally, according to GISS. Records go back to 1880.

Image courtesy of GISS.

Below, Hansen makes some valid points about 2012 and temperature trends.......

The top 10 warmest years on record all occurred since 1998.

The 5-year mean global temperature has been flat for a decade, which they interprete asa combination of natural variability and a slowdown in the growth rate of the net climate forcing.

Short-term global fluctuations are associated principally with natural oscillations of tropical Pacific sea surface temperatures (El Nino/La Nina)

The long-term warming trend, including continual warming since the mid-1970's, has been conclusively associated with the predominant global climate forcing, human-made greenhouse gases, which grew steadily in the early 20th century.

The period of cooling that took place between 1940 and 1975 was likely attributed to a balance of aerosol cooling from low air pollution standards and greenhouse gas warming.

A slower growth rate of the net climate forcing may have contributed to the standstill of global

temperature in the past decade, but it cannot explain the standstill, because it is known that the planet has been out of energy balance, more energy coming in from the sun than energy being radiated to space. The planetary energy imbalance is due largely to the increase of climate forcings in prior decades and the great thermal inertia of the ocean. The more important factor in the standstill is probably unforced dynamical variability, essentially climatic "noise".

If solar irradiance were the dominant drive of climate change that most global warming contrarians believe, then a global cooling trend might be expected.

......the continuing planetary energy imbalance and the rapid increase of CO2 emissions from fossil fuel use assure that global warming will continue on decadal time scales.

Our interpretation of the larger role of unforced variability in temperature change of the past decade, suggests that global temperature will rise significantly in the next few years as the tropics moves inevitably into the next El Nino phase.

The one major wild card in projections of future climate change is the unmeasured climate forcing due to aerosol changes and their effects on clouds.

The "climate dice" are now sufficiently loaded that an observant person should notice that unusually warm seasons are occurring much more frequently than they did a few decades earlier.

The views expressed are those of the author and not necessarily those of AccuWeather, Inc. or AccuWeather.com

دانلود کتابهای با محوریت تغییر اقلیم

داغ                                               داغ

با سلام خدمت دوستای عزیزم

امروز ی لینک واستون گذاشتم که بطور مستقیم و راحت بتونید کتابهای مختلف با محوریت تغییر اقلیم رو دانلود کنید.

http://libgen.info/search.php?search_type=magic&search_text=climate+change&submit=%D0%9F%D0%BE%D0%B8%D1%81%D0%BA

ساختارشناسی یک سیکلون حاره ای

با سلام

امروز ی پست جالب رو به نقل از ناسا براتون میزارم که مربوط به ساختار شناسی سیکلونهای حاره ای و بررسی سع بعدی این پدیده اس.

NASA Sees Cyclone Evan Blown Apart by Wind Shear

Cyclone Evan is no more than a remnant low pressure area in the South Pacific Ocean now. NOAA's GOES-15 satellite captured an image of the remnants from its fixed orbit in space on Dec. 20 that showed strong wind shear had basically blown the storm apart.

The last official bulletin by the Joint Typhoon Warning Center was issued on Dec. 19 at 2100 UTC (4 p.m. EST/U.S. or 12:56 a.m. Fiji local time on Dec. 20). At that time, Evan's maximum sustained winds were still near 35 knots (40 mph/64.8 kph) and it had transitioned into an extra-tropical storm. It was located 400 nautical miles south of Nadi, Fiji, near 24.3 south latitude and 178.5 east longitude. Evan was moving to the south-southeast at 4 knots (4.6 mph/7.4 kph). Evan has since become a remnant low pressure system. 

NOAA's GOES-15 satellite captured an infrared image of Evan's remnants on Dec. 20 at 1500 UTC (10 a.m. EST) showed the remnants of former Tropical Cyclone Evan blown apart by very strong wind shear, northeast of New Zealand. The low pressure center appears northwest of the plume of clouds associated Evan's remnants. The image was created by NASA's GOES Project, located at NASA's Goddard Space Flight Center in Greenbelt, Md. 

Northwesterly wind shear continued to be very strong, blowing between 40 and 50 knots (46 and 57.5 mph/74 and 92.6 kph) and cooler ocean waters were weakening Evan quickly. 

Evan has now gone into the history books as one of the strongest cyclones to hit Fiji and American Samoa in recent memory.

Text Credit: Rob Gutro
NASA's Goddard Space Flight Center


Update Two: 

AIRS image of Evan› Larger image
This time series of infrared images from the AIRS instrument aboard NASA's Aqua satellite show the changes in intense thunderstorms (purple) within Cyclone Evan as it weakened from Cyclone to Tropical Storm strength in 36 hours. The left image is from Dec. 18, center from Dec. 19 at 0159 UTC, and right from Dec. 19 at 1259 UTC, showing a smaller area of intense storms, and the cyclone appears more disorganized. Credit: NASA JPL, Ed Olsen
Time Series of Infrared NASA Images Show Cyclone Evan's Decline

Cyclone Evan is now far south of Fiji and wind shear and cooler sea surface temperatures have been taking their toll on the storm and weakening it. Infrared data from NASA's Aqua satellite has shown a quick decline in the storm's structure over one day.

A time series of infrared images from the Atmospheric Infrared Sounder (AIRS) instrument that flies aboard NASA's Aqua satellite showed changes in intense thunderstorms within Cyclone Evan between Dec. 18 and Dec. 19. Over a time period of 36 hours, Evan weakened from Cyclone strength to Tropical Storm strength. In an AIRS image captured on Dec. 18 there were two large areas of strong thunderstorms with very cold cloud top temperatures colder than -63 Fahrenheit (-52 Celsius). 

By Dec. 19 at 0159 UTC (Dec. 18 at 8:59 p.m. EST/U.S.) the area of strong thunderstorms had become smaller, and the storm appeared less organized. In the AIRS infrared image from Dec. 19 at 1259 UTC (7:59 a.m. EST), the area of strongest thunderstorms had been reduced further and cloud top temperatures throughout the storm were warming, indicating cloud heights were falling because of less evaporation. Evan had moved over sea surface temperatures below the 80 degree Fahrenheit (26.6 degree Celsius) threshold, so evaporation and thunderstorm development had waned. 

Wind shear had increased as well, pushing the bulk of the thunderstorm activity about 65 nautical miles (74.8 miles/120.4 km) to the southeast, according to the Joint Typhoon Warning Center. Northwesterly wind shear was very strong, blowing between 40 and 50 knots (46 and 57.5 mph/74 and 92.6 kph). Animated multi-spectral satellite imagery also showed the low-level circulation center remains fully exposed.

On Dec. 19 at 0900 UTC (4 a.m. EST/U.S.), Evan was a tropical storm with maximum sustained winds near 45 knots (51.7 mph/83.3 kph). It was located about 335 nautical miles (385.5 miles/620.4 km) south of Nadi, Fiji, near 23.7 south latitude and 178.3 east longitude. Evan was moving to the south-southeast at 7 knots (8 mph/13 kph). 

Forecasters at the Joint Typhoon Warning Center noted that because of the strong wind shear and cooler sea surface temperatures, Evan may dissipate sometime on Dec. 20. 

Text Credit: Rob Gutro
NASA's Goddard Space Flight Center


Dec. 19, 2012

Update One: 

TRMM image of Evan› Larger image
TRMM captured data on Cyclone Evan's cloud heights and rainfall on Dec. 16 and spotted an extremely tall storm-cell in the north side of the eyewall. The updrafts in this tower extended high enough to lift precipitation-size ice 17 km above the ocean surface (red in the image). The insert shows the infrared cloud top temperatures. The clockwise arrow shows the direction of the winds circling the eyewall. At the north side of the eyewall, the explosive circular shape is the upper-level outflow from the extremely tall tower, Credit: NASA/Owen Kelley
NASA Satellite Finds an Unusually Tall Storm-cell in Cyclone Evan

NASA's Tropical Rainfall Measuring Mission or TRMM satellite found an unusually tall towering thunderstorm in Cyclone Evan. 

According to Owen Kelley of the TRMM satellite team at NASA's Goddard Space Flight Center in Greenbelt, Md, the most startling feature of the December 16 overflight of Tropical Cyclone Evan was the extremely tall storm-cell in the north side of the eyewall. At the time TRMM passed overhead and captured an image of the storm, Evan was about to rake across the northern coast of the islands of Fiji. 

The updrafts in this tower extended high enough to lift precipitation-size ice 17 km (10.5 miles) above the ocean surface. Tall precipitation cells are generally taken to be anything at least 14.5 km (9 miles) high and are nicknamed "hot towers," but what was seen in Evan's eyewall was a different category of storm cell. 

Storm-cells as tall as the one in the eyewall of Evan have been long known to occur occasionally over land, but before the TRMM satellite, there were not thought to occur over ocean far from land. While field campaigns have periodically studied one location or other over the ocean, what TRMM has taught us is that such sporadic observations are insufficient if you want catch rare events. After 15 years of continuous operation, TRMM satellite reveals the rare features and challenges our understanding of how the weather works. The ocean is an unlikely place to find extremely tall oceanic cells because the ocean surface stays roughly constant in temperature, unlike the land which quickly heats up over the course of a day, increasing low-level instability, and encouraging tall cells to form.

ادامه نوشته

Plant Stress Paints Early Picture of Drought

In July 2012, farmers in the U.S. Midwest and Plains regions watched crops wilt and die after a stretch of unusually low precipitation and high temperatures. Before a lack of rain and record-breaking heat signaled a problem, however, scientists observed another indication of drought in data from NASA and NOAA satellites: plant stress. 

Healthy vegetation requires a certain amount of water from the soil every day to stay alive, and when soil moisture falls below adequate levels, plants become stressed. Scientists with the U.S. Department of Agriculture’s Agricultural Research Service (USDA-ARS) have developed a way to use satellite data to map that plant stress. The maps could soon aid in drought forecasts, and prove useful for applications such as crop yield estimates or decisions about crop loss compensation.

"Crop drought monitoring is of high practical value, and any advance notice of drought conditions helps the farmer make practical decisions sooner," says Steve Running, an ecologist at University of Montana in Missoula.

A new animation of plant stress (top) shows how drought evolved across the United States from January 2010 through September 2012. In spring 2010, satellites measured cool leaf temperatures, indicating healthy plants and wetter-than-average conditions (green), over many areas across the country. By summer 2011, satellites saw the warming of stressed vegetation, indicating significantly lower-than-usual water availability (red) in many areas, most notably in Texas. Crops were either dead or would soon be dead. 

drought map showing deep red - dryness - over Texas and the southwest› Larger image 

Plant stress on June 24, 2011, (top) indicated significant drought in southern U.S. states, while plant stress on August 28, 2012, (bottom) indicated significant drought in the U.S. Midwest. Credit:NASA/Goddard Scientific Visualization Studio/USDA-ARS 

drought map showing deep rust stain across the midwest, darkest across the Mississippi valley› Larger image
Drought in 2012 was the most severe and extensive in at least 25 years, according to the USDA's Economic Research Service. By August 60 percent of farms were in areas experiencing drought, and by mid-September USDA had designated more than 2,000 counties as disaster areas. "2012 was record-breaking, this was just a huge event," says Martha Anderson with USDA-ARS in Beltsville, Md., who is working with a team to develop the plant stress indicator for drought and presented the research Dec. 5, at the American Geophysical Union meeting in San Francisco.

The 2012 event is what experts call a flash drought, meaning that it evolved quickly and unexpectedly. Low soil moisture was further depleted by the heat wave that started in May, and drought abruptly followed. By about May 5 the core regions of drought began to appear on the plant stress map – earlier than the signs of drought appeared in other indicators, such as rainfall measurements.

"We think there's some early-warning potential with these plant stress maps, alerting us as the crops start to run out of water," Anderson says. Signals of plant stress may often appear first in satellite-derived maps of vegetation temperature before the crops have actually started to wilt and die. "The earlier we can learn things are turning south, presumably the more time we have to prepare for whatever actions might be taken." 

Related Links:

NASA at the American Geophysical Union meeting
http://www.nasa.gov/agu

Drought: The Creeping Disaster
http://earthobservatory.nasa.gov/Features/DroughtFacts/drought_facts.php 

NASA MODIS
http://modis.gsfc.nasa.gov 

USDA Agricultural Research Service
http://www.ars.usda.gov/main/main.htm


Kathryn Hansen
NASA's Goddard Space Flight Center, Greenbelt, Md.

ادامه نوشته

Climate Change: Tourism's Roles in Promoting Climate Action

Climate Change: Tourism's Roles in Promoting Climate Action

Every week, the TIES team will publish a discussion article focusing on current issues, challenges and opportunities related to ecotourism, which will hopefully inspire comments, actions, and lively discussions from our members. This week, we are excited to introduce our first issue: climate change and tourism’s role in promoting climate action. What do you think about the relationship between climate change and the tourism industry? Do you know any best practice examples of tourism organizations or leaders implementing carbon mitigation practices? Do you have your own examples of successful climate action?Head over to TIES-EXCHANGE to add your comments and ideas related to this topic! (Member log-in required) 

 Climate Change and Tourism Climate Change and Tourism


The UN Climate Change Conference (COP18) in Qatar starts today, and in the next two weeks discussions will be held to assess progress in dealing with climate change. The UN climate talks shed light to the urgent needs for bold climate action, and this is a perfect time for all of us in the tourism industry to evaluate the challenges and opportunities to promote positive climate action through tourism.


Tourism and Climate Change

The tourism industry, directly and indirectly, is both a cause of and significantly impacted by climate change. Infrastructure required to maintain attractive tourism destinations inevitably involve energy and resource consumption, putting added pressure on the local ecosystems. According to the International Air Transport Association (IATA), transport-related carbon emissions account for 2% of all carbon emissions worldwide, and are rising fast. The EU Airline emissions trading system, where they receive tradable allowances and cap their emissions, is an example of regional efforts to help the tourism sector curb its emissions.


ادامه نوشته

انیمیشن های اقلیمی

سلام دوباره خدمت دوستای خودم

اینم ی سایت برای مشاهده انیمیشن از پدیده های اقلیمی

http://educypedia.karadimov.info/education/climateanimations.htm

امیدورم استفاده کنید.

دانلود ویدیوهایی در مورد تغییر اقلیم

با سلام

در این پست لینکی رو براتو گذاشتم که میتونید ویدیوهای جالبی در مورد تغییر اقلیم را دانلود و استفاده کنید.

برای استفاده روی لینک زیر کلیک کنید:

http://climate.nasa.gov/climate_reel


Glossary of Climate Change Terms

A

Abrupt Climate Change 
Sudden (on the order of decades), large changes in some major component of the climate system, with rapid, widespread effects.

Adaptation 
Adjustment or preparation of natural or human systems to a new or changing environment which moderates harm or exploits beneficial opportunities.

Adaptive Capacity 
The ability of a system to adjust to climate change (including climate variability and extremes) to moderate potential damages, to take advantage of opportunities, or to cope with the consequences.

Aerosols 
Small particles or liquid droplets in the atmosphere that can absorb or reflect sunlight depending on their composition.

Afforestation 
Planting of new forests on lands that historically have not contained forests. [1]

Albedo 
The amount of solar radiation reflected from an object or surface, often expressed as a percentage.

Alternative Energy 
Energy derived from nontraditional sources (e.g., compressed natural gas, solar, hydroelectric, wind). [2]

Annex I Countries/Parties 
Group of countries included in Annex I (as amended in 1998) to the United Nations Framework Convention on Climate Change, including all the developed countries in the Organization of Economic Co-operation and Development, and economies in transition. By default, the other countries are referred to as Non-Annex I countries. Under Articles 4.2 (a) and 4.2 (b) of the Convention, Annex I countries commit themselves specifically to the aim of returning individually or jointly to their 1990 levels of greenhouse gas emissions by the year 2000. [2]

Anthropogenic 
Made by people or resulting from human activities. Usually used in the context of emissions that are produced as a result of human activities. [3]

Atmosphere 
The gaseous envelope surrounding the Earth. The dry atmosphere consists almost entirely of nitrogen (78.1% volume mixing ratio) and oxygen (20.9% volume mixing ratio), together with a number of trace gases, such as argon (0.93% volume mixing ratio), helium, radiatively active greenhouse gases such as carbon dioxide (0.035% volume mixing ratio), and ozone. In addition the atmosphere contains water vapor, whose amount is highly variable but typically 1% volume mixing ratio. The atmosphere also contains clouds and aerosols. [1]

Atmospheric Lifetime 
Atmospheric lifetime is the average time that a molecule resides in the atmosphere before it is removed by chemical reaction or deposition. This can also be thought of as the time that it takes after the human-caused emission of a gas for the concentrations of that gas in the atmosphere to return to natural levels. Greenhouse gas lifetimes can range from a few years to a few thousand years.

B

Biofuels 
Gas or liquid fuel made from plant material (biomass).  Includes wood, wood waste, wood liquors, peat, railroad ties, wood sludge, spent sulfite liquors, agricultural waste, straw, tires, fish oils, tall oil, sludge waste, waste alcohol, municipal solid waste, landfill gases, other waste, and ethanol blended into motor gasoline. [4]

Biogeochemical Cycle 
Movements through the Earth system of key chemical constituents essential to life, such as carbon, nitrogen, oxygen, and phosphorus. [3]

Biomass 
Materials that are biological in origin, including organic material (both living and dead) from above and below ground, for example, trees, crops, grasses, tree litter, roots, and animals and animal waste. [4]

Biosphere 
The part of the Earth system comprising all ecosystems and living organisms, in the atmosphere, on land (terrestrial biosphere) or in the oceans (marine biosphere), including derived dead organic matter, such as litter, soil organic matter and oceanic detritus. [1]

Black Carbon Aerosol 
Black carbon (BC) is the most strongly light-absorbing component of particulate matter (PM), and is formed by the incomplete combustion of fossil fuels, biofuels, and biomass. It is emitted directly into the atmosphere in the form of fine particles (PM2.5).

Borehole 
Any exploratory hole drilled into the Earth or ice to gather geophysical data. Climate researchers often take ice core samples, a type of borehole, to predict atmospheric composition in earlier years. 


ادامه نوشته

?Climate change: How do we know  

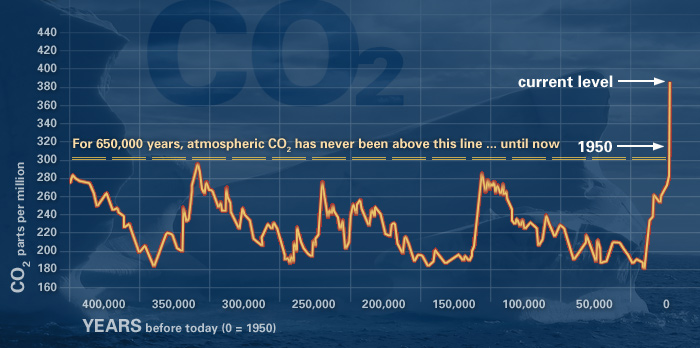
Variation in carbon dioxide concentration during the past 400,000 years (historical data from the Vostock ice core).

This graph, based on the comparison of atmospheric samples contained in ice cores and more recent direct measurements,
provides evidence that atmospheric CO2 has increased since the Industrial Revolution. (Source: NOAA)

The Earth's climate has changed throughout history. Just in the last 650,000 years there have been seven cycles of glacial advance and retreat, with the abrupt end of the last ice age about 7,000 years ago marking the beginning of the modern climate era — and of human civilization. Most of these climate changes are attributed to very small variations in Earth’s orbit that change the amount of solar energy our planet receives.

"Scientific evidence for warming of the climate system is unequivocal."
- Intergovernmental Panel on Climate Change

The current warming trend is of particular significance because most of it is very likely human-induced and proceeding at a rate that is unprecedented in the past 1,300 years.1

Earth-orbiting satellites and other technological advances have enabled scientists to see the big picture, collecting many different types of information about our planet and its climate on a global scale. Studying these climate data collected over many years reveal the signals of a changing climate.

Certain facts about Earth's climate are not in dispute:

  • The heat-trapping nature of carbon dioxide and other gases was demonstrated in the mid-19th century.2 Their ability to affect the transfer of infrared energy through the atmosphere is the scientific basis of many JPL-designed instruments, such as AIRS. Increased levels of greenhouse gases must cause the Earth to warm in response.
  • Ice cores drawn from Greenland, Antarctica, and tropical mountain glaciers show that the Earth’s climate responds to changes in solar output, in the Earth’s orbit, and in greenhouse gas levels. They also show that in the past, large changes in climate have happened very quickly, geologically-speaking: in tens of years, not in millions or even thousands.3

The evidence for rapid climate change is compelling:


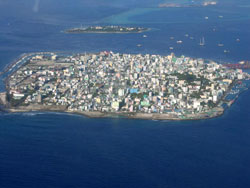
Republic of Maldives: Vulnerable to sea level rise

Sea level rise

Global sea level rose about 17 centimeters (6.7 inches) in the last century. The rate in the last decade, however, is nearly double that of the last century.4

The effects of climate change will likely include more frequent droughts in some areas and heavier precipitation in others.

Global temperature rise

All three major global surface temperature reconstructions show that Earth has warmed since 1880. 5 Most of this warming has occurred since the 1970s, with the 20 warmest years having occurred since 1981 and with all 10 of the warmest years occurring in the past 12 years. 6 Even though the 2000s witnessed a solar output decline resulting in an unusually deep solar minimum in 2007-2009, surface temperatures continue to increase. 7

The oceans have absorbed much of this increased heat, with the top 700 meters (about 2,300 feet) of ocean showing warming of 0.302 degrees Fahrenheit since 1969.

Warming oceans

The oceans have absorbed much of this increased heat, with the top 700 meters (about 2,300 feet) of ocean showing warming of 0.302 degrees Fahrenheit since 1969.8

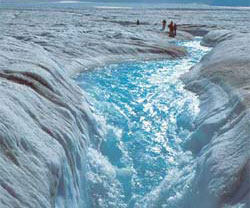
Flowing meltwater from the Greenland ice sheet

Shrinking ice sheets

The Greenland and Antarctic ice sheets have decreased in mass. Data from NASA's Gravity Recovery and Climate Experiment show Greenland lost 150 to 250 cubic kilometers (36 to 60 cubic miles) of ice per year between 2002 and 2006, while Antarctica lost about 152 cubic kilometers (36 cubic miles) of ice between 2002 and 2005.

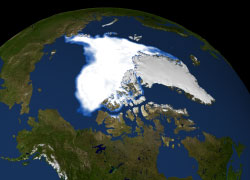
Visualization of the 2007 Arctic sea ice minimum

Declining Arctic sea ice

Both the extent and thickness of Arctic sea ice has declined rapidly over the last several decades. 9

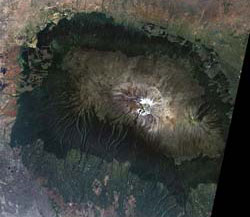
The disappearing snowcap of Mount Kilimanjaro, from space.

Glacial retreat

Glaciers are retreating almost everywhere around the world — including in the Alps, Himalayas, Andes, Rockies, Alaska and Africa.10

Record high temperatures increasing.

Extreme events

The number of record high temperature events in the United States has been increasing, while the number of record low temperature events has been decreasing, since 1950. The U.S. has also witnessed increasing numbers of intense rainfall events.11

The carbon dioxide content of the Earth’s oceans has been increasing since 1750, and is currently increasing about 2 billion tons per year. This has increased ocean acidity by about 30 percent.

Ocean acidification

Since the beginning of the Industrial Revolution, the acidity of surface ocean waters has increased by about 30 percent.12,13 This increase is the result of humans emitting more carbon dioxide into the atmosphere and hence more being absorbed into the oceans. The amount of carbon dioxide absorbed by the upper layer of the oceans is increasing by about 2 billion tons per year.14,15

Clean Logo

This resource has been selected for inclusion in the CLEAN collection


References

1 IPCC Fourth Assessment Report, Summary for Policymakers, p. 5

B.D. Santer et.al., “A search for human influences on the thermal structure of the atmosphere,” Nature vol 382, 4 July 1996, 39-46

Gabriele C. Hegerl, “Detecting Greenhouse-Gas-Induced Climate Change with an Optimal Fingerprint Method,” Journal of Climate, v. 9, October 1996, 2281-2306

V. Ramaswamy et.al., “Anthropogenic and Natural Influences in the Evolution of Lower Stratospheric Cooling,” Science 311 (24 February 2006), 1138-1141

B.D. Santer et.al., “Contributions of Anthropogenic and Natural Forcing to Recent Tropopause Height Changes,” Science vol. 301 (25 July 2003), 479-483.

2 In the 1860s, physicist John Tyndall recognized the Earth's natural greenhouse effect and suggested that slight changes in the atmospheric composition could bring about climatic variations. In 1896, a seminal paper by Swedish scientist Svante Arrhenius first speculated that changes in the levels of carbon dioxide in the atmosphere could substantially alter the surface temperature through the greenhouse effect.

3 National Research Council (NRC), 2006. Surface Temperature Reconstructions For the Last 2,000 Years. National Academy Press, Washington, DC.

4 Church, J. A. and N.J. White (2006), A 20th century acceleration in global sea level rise, Geophysical Research Letters, 33, L01602, doi:10.1029/2005GL024826.

The global sea level estimate described in this work can be downloaded
from the CSIRO website.

5http://www.ncdc.noaa.gov/oa/climate/research/ anomalies/index.html

http://www.cru.uea.ac.uk/cru/data/temperature

http://data.giss.nasa.gov/gistemp

6 T.C. Peterson et.al., "State of the Climate in 2008," Special Supplement to the Bulletin of the American Meteorological Society, v. 90, no. 8, August 2009, pp. S17-S18.

7 I. Allison et.al., The Copenhagen Diagnosis: Updating the World on the Latest Climate Science, UNSW Climate Change Research Center, Sydney, Australia, 2009, p. 11

http://www.giss.nasa.gov/research/news/20100121/

http://science.nasa.gov/headlines/y2009/ 01apr_deepsolarminimum.htm

8 Levitus, et al, "Global ocean heat content 1955–2008 in light of recently revealed instrumentation problems," Geophys. Res. Lett. 36, L07608 (2009).

9 L. Polyak, et.al., “History of Sea Ice in the Arctic,” in Past Climate Variability and Change in the Arctic and at High Latitudes, U.S. Geological Survey, Climate Change Science Program Synthesis and Assessment Product 1.2, January 2009, chapter 7

R. Kwok and D. A. Rothrock, “Decline in Arctic sea ice thickness from submarine and ICESAT records: 1958-2008,” Geophysical Research Letters, v. 36, paper no. L15501, 2009

http://nsidc.org/sotc/sea_ice.html

10 National Snow and Ice Data Center

World Glacier Monitoring Service

11 http://lwf.ncdc.noaa.gov/extremes/cei.html

12 http://www.pmel.noaa.gov/co2/story/What+is+Ocean+Acidification%3F (Note: The pH of surface ocean waters has fallen by 0.1 pH units. Since the pH scale is logarithmic, this change represents approximately a 30 percent increase in acidity.)

13 http://www.pmel.noaa.gov/co2/story/Ocean+Acidification

14 C. L. Sabine et.al., “The Oceanic Sink for Anthropogenic CO2,” Science vol. 305 (16 July 2004), 367-371

15 Copenhagen Diagnosis, p. 36.

Humans are largely responsible for recent climate change  


smoke coming from a factory

Over the past century, human activities have released large amounts of carbon dioxide and other greenhouse gases into the atmosphere. The majority of greenhouse gases come from burning fossil fuels to produce energy, although deforestation, industrial processes, and some agricultural practices also emit gases into the atmosphere.

Greenhouse gases act like a blanket around Earth, trapping energy in the atmosphere and causing it to warm. This phenomenon is called the greenhouse effect and is natural and necessary to support life on Earth. However, the buildup of greenhouse gases can change Earth's climate and result in dangerous effects to human health and welfare and to ecosystems.

The choices we make today will affect the amount of greenhouse gases we put in the atmosphere in the near future and for years to come.

Climate change is happening  


Our Earth is warming. Earth's average temperature has risen by 1.4°F over the past century, and is projected to rise another 2 to 11.5°F over the next hundred years. Small changes in the average temperature of the planet can translate to large and potentially dangerous shifts in climate and weather.

The evidence is clear. Rising global temperatures have been accompanied by changes in weather and climate. Many places have seen changes in rainfall, resulting in more floods, droughts, or intense rain, as well as more frequent and severe heat waves. The planet's oceans and glaciers have also experienced some big changes - oceans are warming and becoming more acidic, ice caps are melting, and sea levels are rising. As these and other changes become more pronounced in the coming decades, they will likely present challenges to our society and our environment.

آغاز نشست تغییرات آب‌وهوایی سازمان ملل در قطر(به نقل از خبرنامه انجمن اقلیم شناسی)

دور دیگری از مذاکرات مربوط به تغییرات آب‌وهوایی از روز دوشنبه در دوحه قطر آغاز شد. در این اجلاس که ادامه نشست‌های سازمان ملل متحد از بیست سال پیش است، نمایندگان حدود دویست کشور جهان شرکت دارند و دستور کار آن مقابله با گرمایش کره زمین و کمک به کشورهای فقیر برای انطباق با آن است.

خبرگزاری آسوشیتدپرس می‌نویسد که مذاکرات بیست سال گذشته نتوانسته‌اند هدف‌های اصلی این طرح یعنی کاهش گازهای گلخانه‌ای را که علت اصلی گرمایش کره زمین است تامین کنند.

سه سال پیش در اجلاس کپنهاگ کشورهای عضو نتوانستند در مورد یک معاهده بین‌المللی جدید در زمینه کاهش گازهای گلخانه‌ای به توافق برسند. اما سال گذشته قرار شد فرصت دیگری برای ادامه این مذاکرات فراهم شده و تا سال ۲۰۱۵ کشورهای عضو در مورد معاهده تازه‌ای به توافق برسند.

برای تنظیم یک معاهده جدید مسائل مختلفی که تاکنون اختلاف برانگیز بوده‌اند باید حل شوند که یکی از مهم‌ترین عناصر آن نحوه تقسیم مسئولیت برای کاهش مصرف سوخت‌های فسیلی بین کشورهای غنی و فقیر است. بعید است در جریان مذاکرات دو هفته‌ای که در شهر دوحه برگزار می‌شود در این زمینه توافقی حاصل شود.

ادامه نوشته